Iron-carbon phase diagram
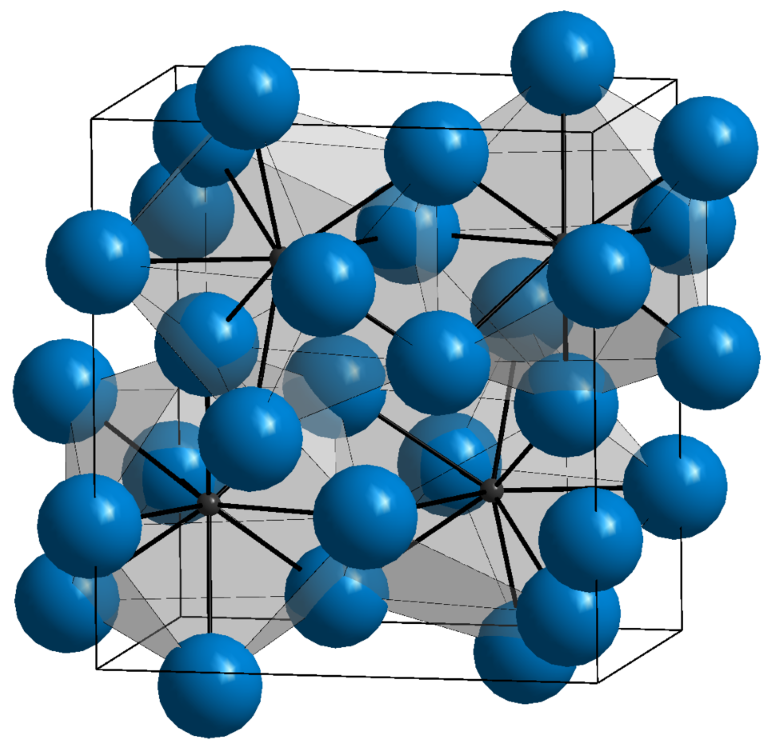
Table of contents
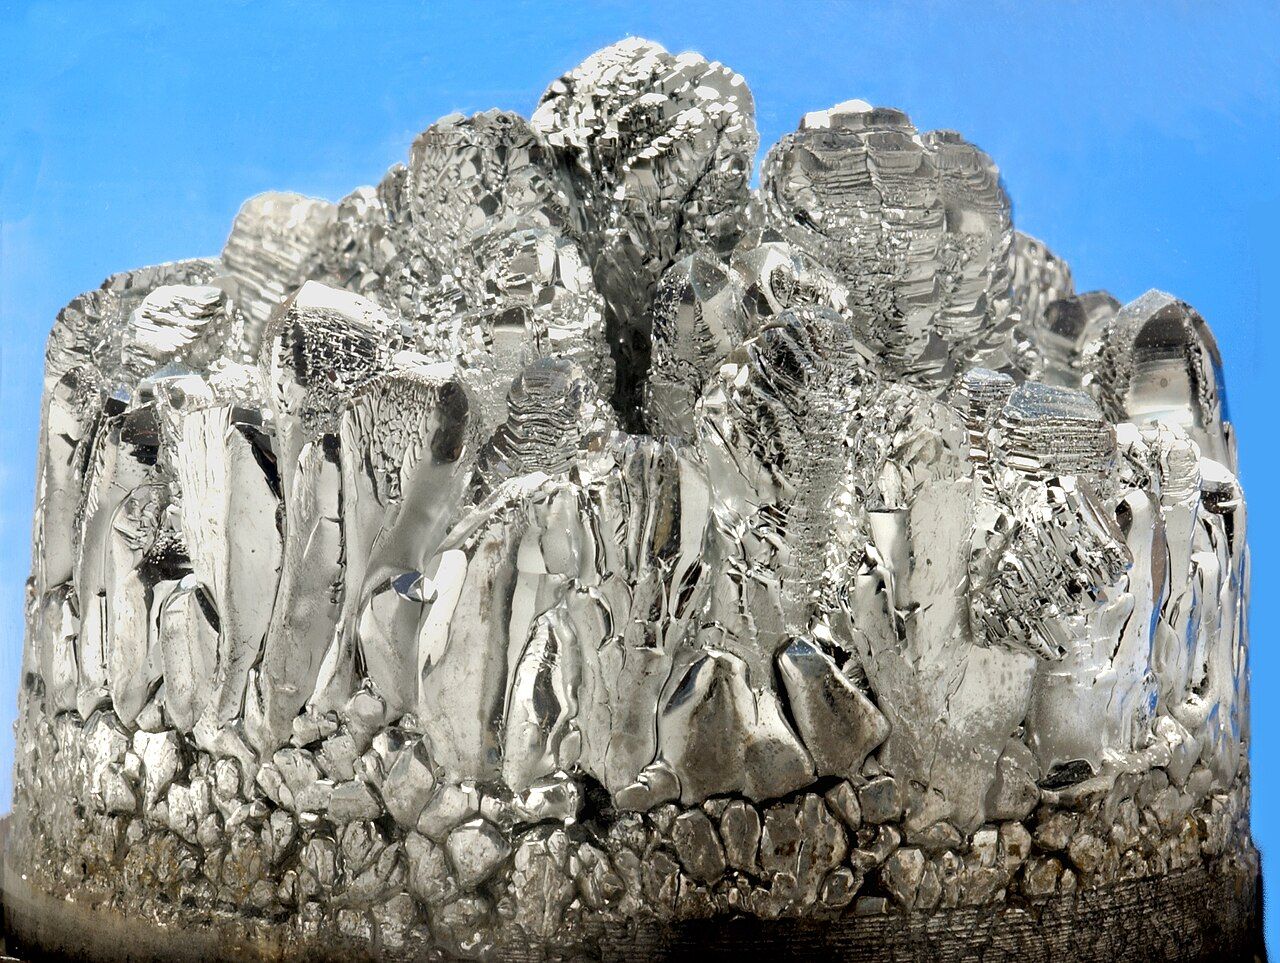
Iron and its alloys form the basis of modern materials engineering. They are used to make load-bearing structures, tools, machines, and elements of industrial infrastructure. The key to understanding the behavior of these materials, both in their solid state and during thermal processes, lies in analyzing the iron-carbon (Fe-C) phase diagram.
The Fe–C phase diagram describes the equilibrium phase transformations that occur in iron alloys containing up to approximately 6.7% carbon. In practice, however, alloys with a much lower content of this element are of most significant importance – i.e., steels (up to 2.11% C) and cast irons (above 2.11% C). Knowledge of the Fe–C phase diagram allows us to predict:
- What crystal structures will form in the alloy after cooling,
- what its mechanical and technological properties will be,
- and how to plan heat treatment to achieve the desired effect.
This is why the iron-carbon phase diagram is considered the most important phase equilibrium diagram in metallurgy, forming the basis for the design, processing, and modification of iron alloys.

Characteristics of the iron-carbon phase diagram
The iron-carbon (Fe-C) phase diagram is a graph showing the relationship between carbon content and temperature for iron alloys in a state of thermodynamic equilibrium. This diagram covers a range up to 6.67% C, which corresponds to the chemical composition of cementite (Fe₃C), a solid intermetallic compound of iron and carbon.
In industrial practice, alloys containing up to 4.3% carbon, i.e,. Various grades of steel and cast iron are of greatest importance. This diagram allows us to determine which phases and microstructures will be present in the material at a given temperature and what phase transformations will occur during cooling or heating.
There are three main phases in the Fe–C phase diagram: ferrite (α), a soft, ductile phase with a regular body-centered (BCC) lattice, capable of dissolving only trace amounts of carbon; austenite (γ), a phase with a regular face-centered cubic (FCC) lattice, which occurs at higher temperatures and can dissolve up to 2.11% carbon; and cementite (Fe₃C), a chemical compound with very high hardness but low plasticity.
The characteristic points of the graph are particularly important: the eutectoid point (727°C, 0.8% C), at which austenite transforms into a mixture of ferrite and cementite, i.e. pearlite; and the eutectic point (1147°C, 4.3% C), where the liquid metal forms ledeburite, a mixture of austenite and cementite. It is also worth mentioning the peritectic transformation (1495°C, 0.16% C), which is mainly of theoretical importance.
The Fe–C phase diagram is a basic tool used in the design of iron alloys, as well as in planning their heat treatment and predicting their operating properties.
Cementite, ferrite, and austenite
The basic phases occurring in the iron-carbon phase diagram are cementite (Fe₃C), ferrite (α), and austenite (γ). Their presence, quantity, and mutual proportions determine the structure and properties of the alloy, both in its raw state and after heat treatment.
Cementite (Fe₃C) is a chemical compound of iron and carbon with a carbon content of 6.67% C. It is a very hard and brittle phase with a hardness of up to 800 HV, but due to its lack of plasticity, it is not a useful material on its own. It occurs as a component of complex structures such as perlite and ledeburite, where its presence significantly affects the abrasion resistance and hardness of the material.
Ferrite (α) is a solid solution of carbon in alpha iron with a spatially centered body-centered (BCC) lattice. It is a soft, ductile, and easily workable phase containing only trace amounts of carbon – a maximum of 0.02% at 727°C. It is thanks to these properties that ferrite is the main phase responsible for ductility and formability in low-carbon steels.
Austenite (γ) is a solid solution of carbon in gamma iron with a face-centered cubic (FCC) lattice. This phase is formed at higher temperatures, and its carbon solubility reaches 2.11% C at 1147°C. Austenite is ductile and non-magnetic, which makes it particularly valuable in heat treatment and surface hardening processes. In addition, due to its structure, austenite can be transformed into other phases (e.g., martensite) as a result of rapid cooling.
The relationship between these three phases – cementite, ferrite, and austenite – is fundamental to understanding the behavior of iron alloys during cooling, heating, and saturation with elements. Controlled phase transformations enable engineers to tailor the microstructure of steel and cast iron to meet specific technological and operational requirements.
Pearlite, ledeburite, and eutectoids
Pearlite is a fine-grained, layered mixture of two phases – ferrite and cementite – formed as a result of the eutectoid transformation of austenite at a temperature of 727°C and a carbon content of 0.8%. It has a characteristic lamellar structure, resembling alternating layers, which combines moderate hardness with good plasticity. In carbon steels, perlite is common and is responsible for the favorable combination of strength and machinability.
Ledeburite is a mixture of austenite and cementite, formed at a temperature of 1147°C and a carbon content of 4.3% C as a result of eutectic liquid transformation. It occurs primarily in cast irons, where it is responsible for very high hardness and abrasion resistance; however, it simultaneously limits the ductility and machinability of the material. Upon further cooling, the austenite contained in ledeburite undergoes secondary transformations, e.g., into pearlite or bainite, depending on the cooling rate.
Eutectoids and eutectics are special points on the Fe–C equilibrium diagram where one phase transforms into a mixture of two others:
- In the case of eutectoid, austenite decomposes into ferrite and cementite (pearlite);
- In the case of eutectic, the liquid metal solidifies directly into a mixture of austenite and cementite (ledeburite).
Classification of iron-carbon alloys: steels and cast irons
Iron-carbon alloys are not classified solely based on their structure, but primarily based on their carbon content. The limit value that separates the two main material groups is 2.11% C, corresponding to the eutectoid point in the Fe-C phase diagram.
Steels are iron alloys that contain up to 2.11% carbon. They are characterized by good plasticity, ductility, and machinability. Thanks to the presence of austenite, ferrite, and pearlite, steels can be hardened, annealed, and tempered, which allows their structure to be modified and their properties adapted to specific applications. The following types are distinguished, among others:
- low-carbon steels (up to 0.3% C) – soft, easily weldable, used in load-bearing structures,
- medium-carbon steels (0.3–0.6% C) – with balanced strength properties,
- high-carbon steels (above 0.6% C) – hard, wear-resistant, used for tools.
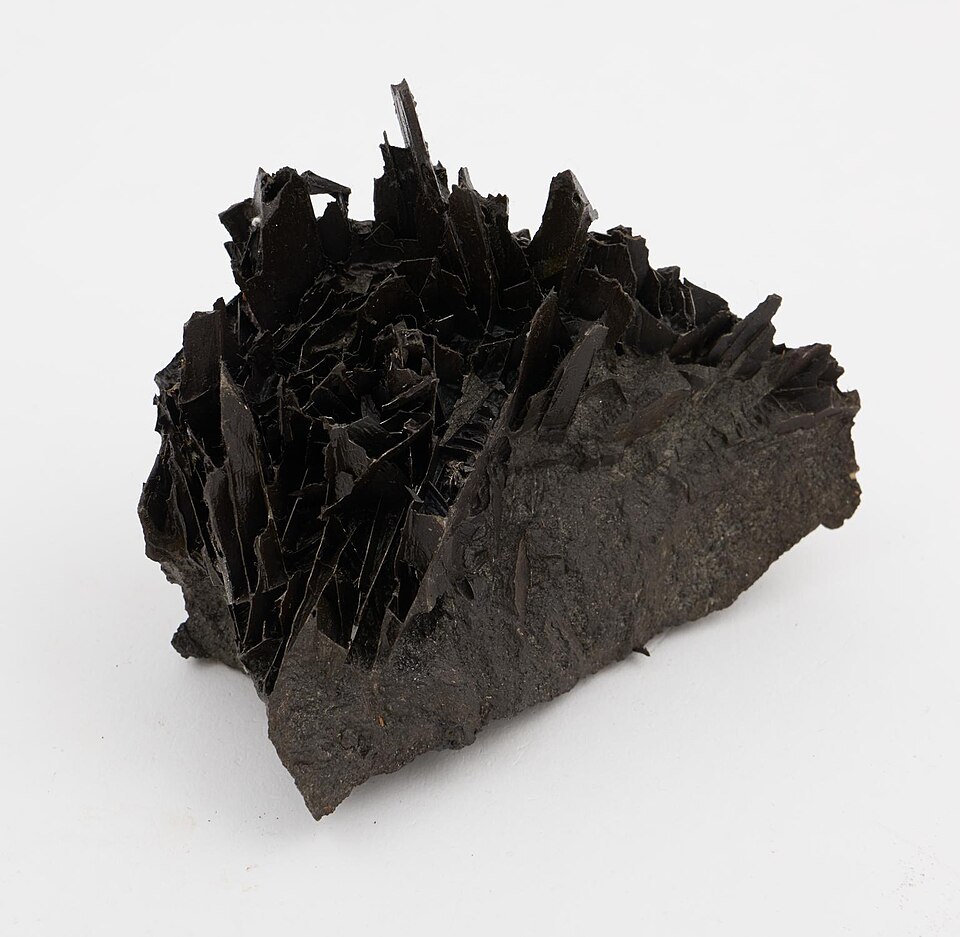
Cast irons are alloys with a carbon content of over 2.11% C, which causes them to solidify through eutectic transformations and contain ledeburite. These materials are wear-resistant, easily cast, and relatively inexpensive; however, they are also brittle and difficult to machine. Depending on the form in which carbon is present in the structure (cementite or graphite), the following types are distinguished:
- white cast iron – with cementite, very hard but brittle,
- gray cast iron – with flake graphite, more machinable and vibration-damping,
- spheroidal graphite iron (SG) – with spherical graphite, with better strength properties,
- ductile iron – heat-treated, with fine graphite, resulting in increased ductility.
Application of the Fe–C equilibrium diagram in industrial practice
The iron-carbon (Fe-C) phase diagram is one of the most important tools used in materials engineering. It enables us to understand and predict the structural changes that occur in iron alloys during heating and cooling, which is crucial for planning technological processes and analyzing the performance of materials.
The diagram can be used, among other things, to determine at what temperatures phase transformations occur, to identify the crystal structures present in a given temperature range, and to understand how the mechanical properties of an alloy change with its carbon content. In practice, this allows engineers to design the entire material processing process, from casting to final heat treatment. Knowledge of the diagram is used in:
- selecting heat treatment parameters such as hardening, annealing, tempering, or normalizing,
- structural diagnostics of materials, especially in the assessment of casting quality or the detection of thermal defects,
- designing alloy compositions for specific mechanical, thermal, and corrosion applications.
It is also worth noting that the Fe-C diagram serves as the starting point for understanding more complex phase diagrams, such as those in alloy steels, where, in addition to carbon, other elements like chromium, nickel, or molybdenum are present, influencing phase transformations and the formation of new structures.
As a result, its application encompasses nearly all stages of the manufacturing and use of iron alloys, from designing the chemical composition through simulations of thermal transformations to optimizing the durability and reliability of finished machine parts and structures.
Iron-carbon phase diagram – summary
The iron-carbon (Fe–C) phase diagram is the foundation of modern materials engineering and metallurgy. It enables us to understand how changes in carbon content and temperature affect the microstructure, mechanical properties, and technological behavior of iron alloys. With this knowledge, engineers can consciously design technological processes and select the appropriate materials for various applications.
Understanding the Fe–C diagram enables control over phase transformations, such as the eutectoid transformation of austenite to pearlite or the eutectic solidification of cast iron alloys into a ledeburite structure. This allows precise control of hardness, plasticity, abrasion resistance, and susceptibility to heat treatment, which directly translates into the durability and reliability of structural components.
Although the Fe–C phase diagram seems relatively simple, its practical significance is enormous. It is from its analysis that the design of steel and cast iron, their modification, as well as the diagnosis of microstructure and causes of damage in finished products, begins. In this sense, the Fe–C equilibrium diagram is not just an academic tool, but an everyday instrument for engineers, allowing them to combine theory with practice, to the benefit of the durability, safety, and efficiency of all iron-based technical infrastructure.